Science / Grade 6
Count cycles, not height
Learning goal: Count complete cycles, divide by elapsed time and separate frequency, amplitude and pitch from loudness using invented records.
Before you start: Divide whole-number counts by seconds. All cycle counts, times and comparison results are spoken; pause to jot them down or replay. The plots are described in words. No listening discrimination or equipment is required.
Read or print this lesson What to practice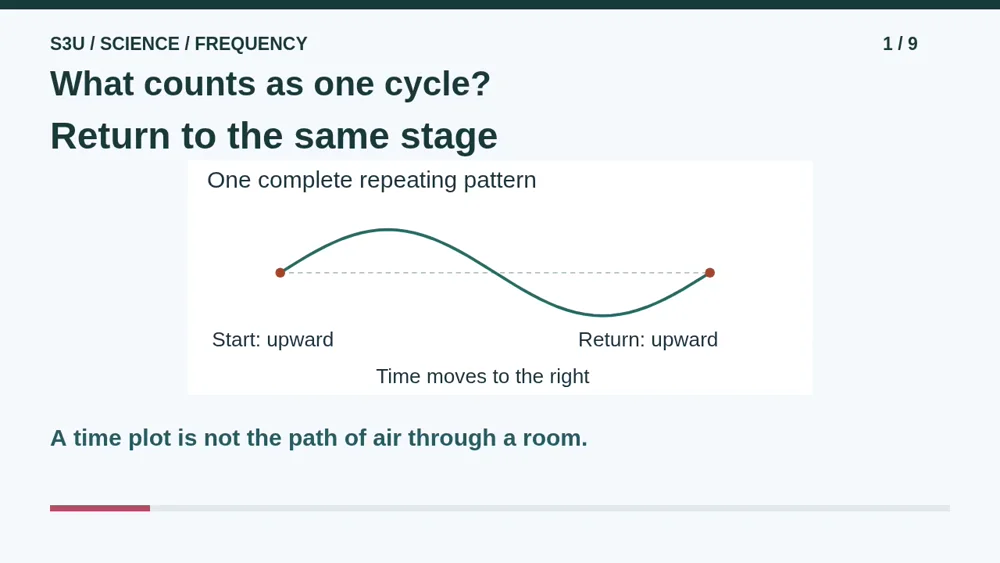
Audio and video share one lesson record. Keep this page open while listening.
Download audio Downloads do not save lesson progress.
The audio could not load. The transcript is still available below.
Next: your worksheet
Count Frequency rather than Loudness - Practice 1
Checking sign-in...
Read the transcript
Saved reading place
Audio transcript and practice. Reading or printing does not count as playback time or an assessed grade.
1. What counts as one cycle?
Audio: 0:00
A repeating signal goes through the same pattern again and again. One complete cycle ends when the pattern returns to the same stage, moving in the same direction. In our drawing, start at the center line moving upward. Follow the high part, the low part, and return to the center moving upward again. That is one cycle, not two. This is a plot of change over time at one place. It is not a picture of air traveling along a wiggly road.
2. Count cycles and seconds
Audio: 0:33
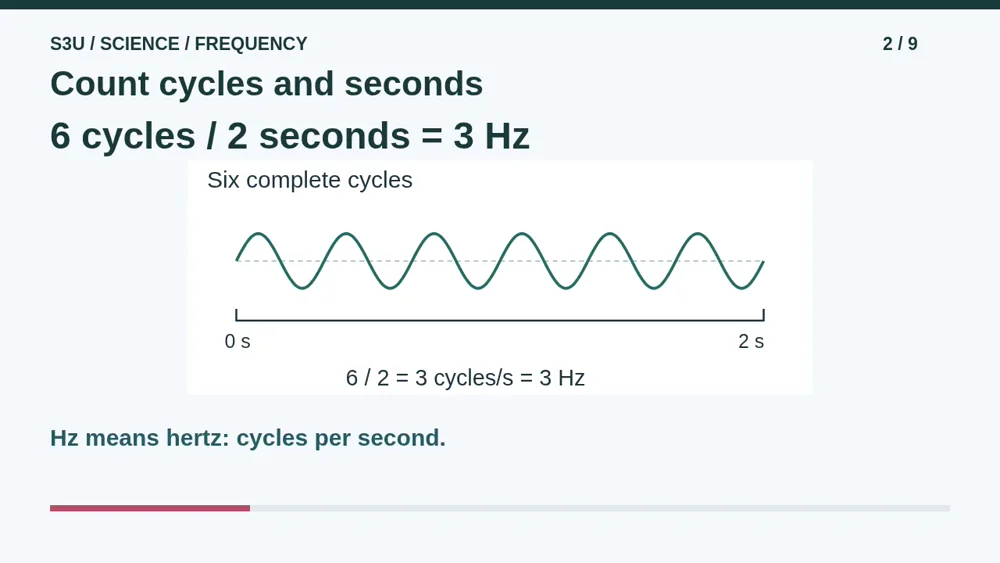
Frequency tells us how often a pattern repeats. Our invented steady signal completes six whole cycles in two seconds. Divide six by two. That gives three cycles each second, or three hertz. We write hertz with the letters H and z. Count complete cycles, not every crossing of the center line. These small numbers make a readable paper model. We are not playing this signal or asking you to make any sound.
3. More cycles can take more time
Audio: 1:06
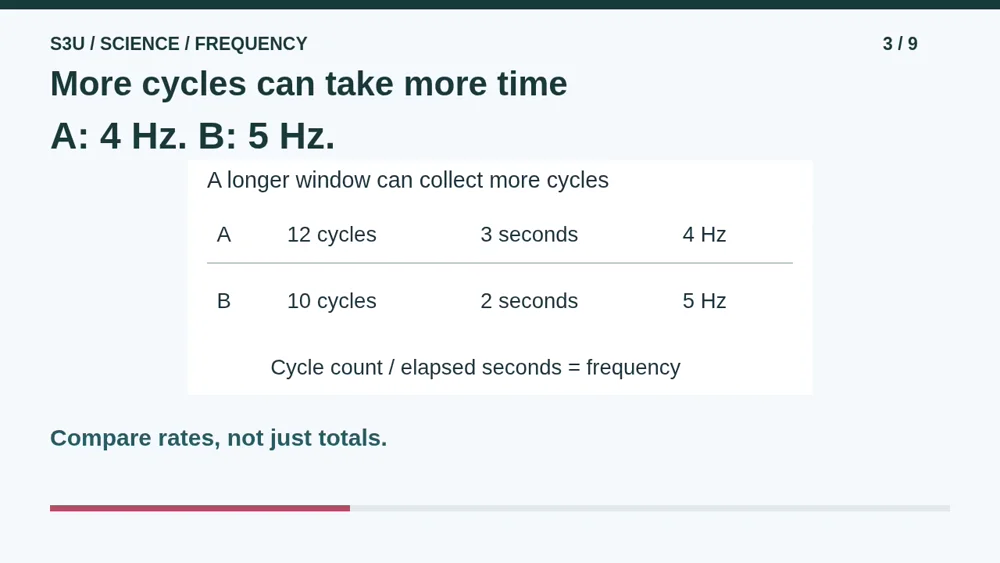
Now compare two invented steady records. Signal A completes twelve cycles in three seconds. Twelve divided by three is four hertz. Signal B completes ten cycles in two seconds. Ten divided by two is five hertz. B repeats more often per second, even though A has more cycles in its longer record. A bigger pile of cycles does not automatically win the frequency race. Check the time window before comparing.
4. Taller is a different change
Audio: 1:40
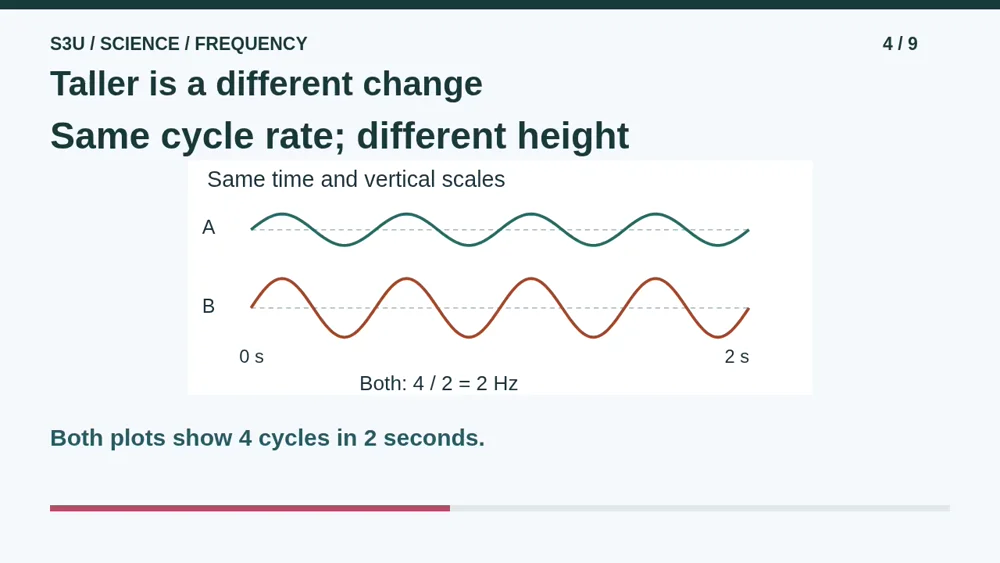
These two plots use the same time scale. Each contains four complete cycles in two seconds, so each is two hertz. One plot reaches farther above and below its center line. That larger height represents a larger amplitude on this shared vertical scale. It does not add extra cycles. A wave drawing does not earn more hertz by standing on tiptoe. Count repetition across time separately from the size of the change.
5. Pitch is not loudness
Audio: 2:12
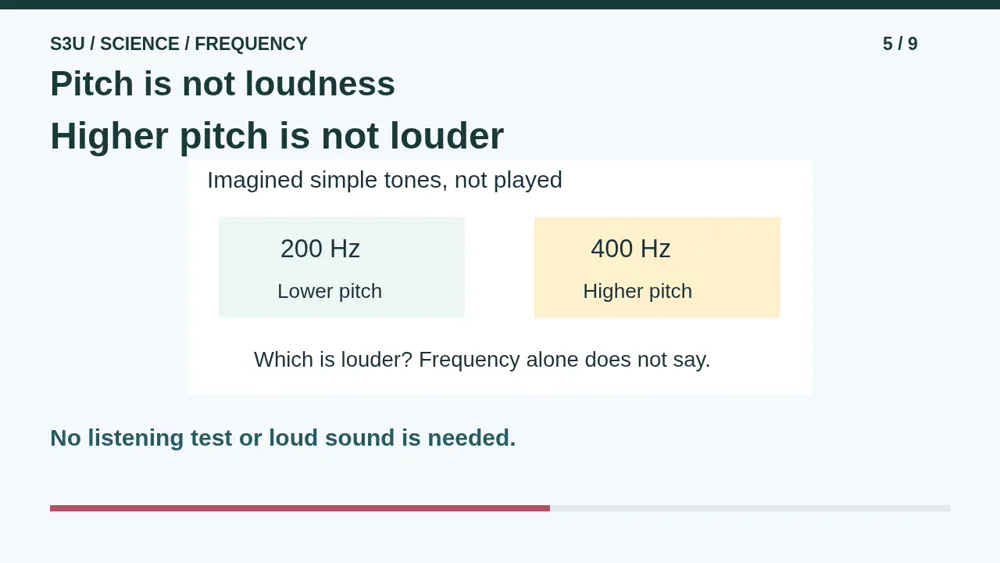
For simple sound tones, a higher frequency corresponds to a higher pitch. An imagined four hundred hertz tone has a higher pitch than an imagined two hundred hertz tone. That comparison does not tell us which is louder. Loudness and pitch describe different features. Louder is not another word for higher pitched. A listener saying louder also does not give an exact numerical loudness ratio. We will read the labels, not play a hearing test. Keep any lesson audio at a comfortable level.
6. Pause: compare three records
Audio: 2:50
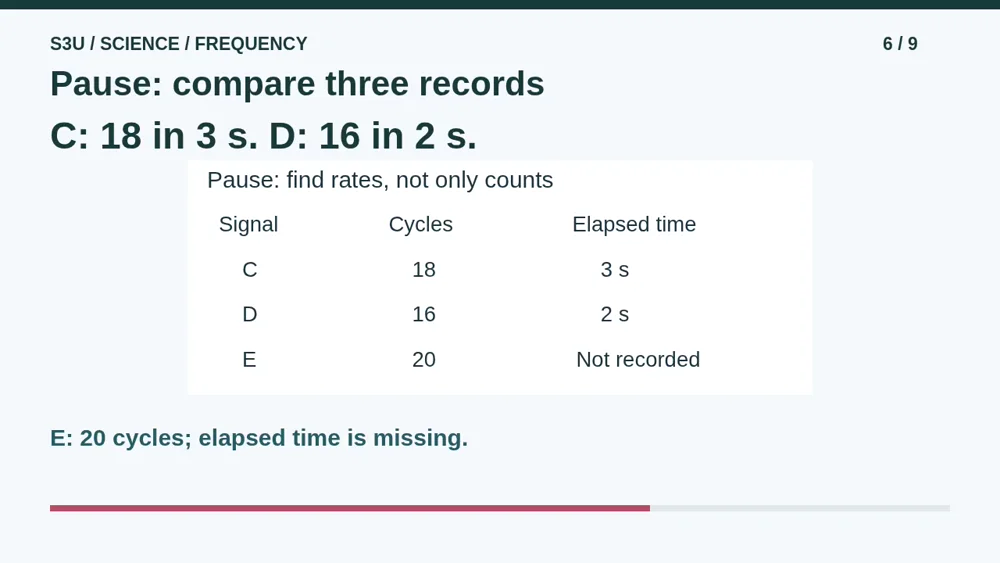
Pause for three new invented steady signals. C completes eighteen cycles in three seconds. D completes sixteen cycles in two seconds. E has twenty recorded cycles, but its elapsed time is missing. Calculate the frequency of C and D. Which repeats more often per second? Can you find the frequency of E from this record? Say or write your reasoning before continuing. Remember that a cycle count needs a time window.
7. Check the rates and the gap
Audio: 3:24
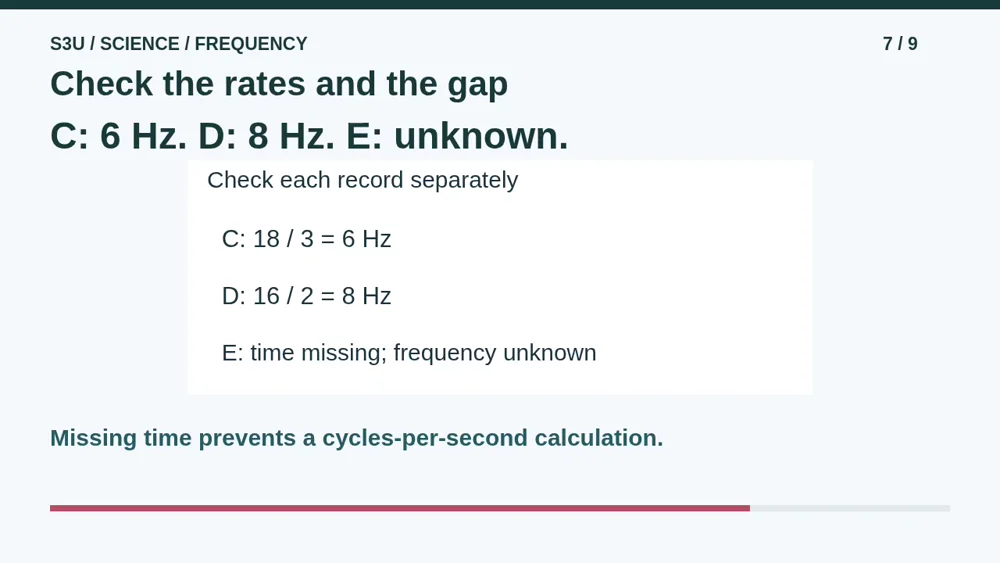
For C, eighteen divided by three is six hertz. For D, sixteen divided by two is eight hertz. D has the higher frequency, even though C has more total cycles. For E, twenty cycles alone is not enough. Twenty cycles in two seconds would be ten hertz. Twenty cycles in four seconds would be five hertz. Without its actual elapsed time, keep E unknown. Do not fill the missing cell with a guess.
8. A longer record, the same rate
Audio: 3:57
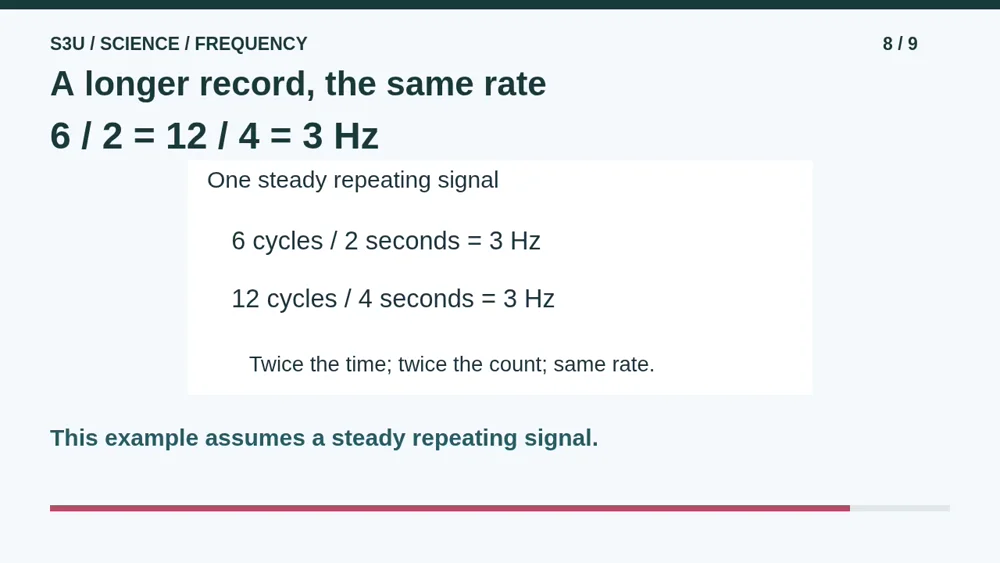
Fun fact: a longer observation can contain more cycles without having a higher frequency. Our steady three hertz model completes six cycles in two seconds and twelve cycles in four seconds. Both divisions give three hertz. The total doubles because we watch for twice as long. This assumes the signal stays steady. If its repetition rate changes, one total divided by all the seconds describes the average cycle rate over that window, not necessarily the rate at every moment.
9. Continue to the worksheet
Audio: 4:34
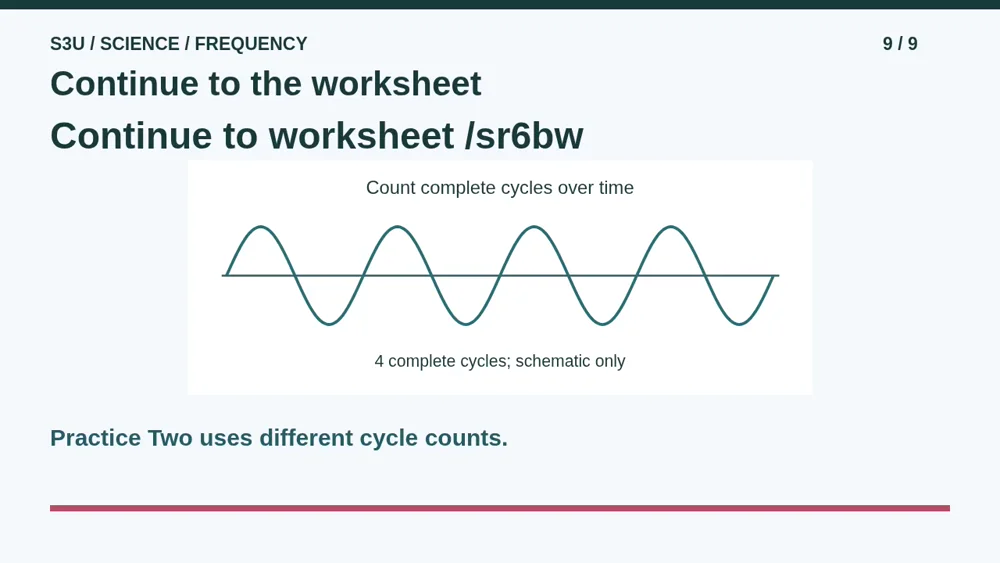
Continue to the frequency worksheet below. Each question gives a new cycle count and an elapsed time. Divide cycles by seconds and write the result in hertz. Practice Two gives different counts. You can work on screen or print a copy. Explain why a taller drawn wave or a louder description cannot replace the missing time in a frequency calculation. These are paper records. No equipment, loud sound, upload or personal measurement is needed.
Show your understanding
You can point, explain aloud, draw or write.
- Identify a complete cycle and calculate a steady frequency from cycle count and elapsed seconds, including different time windows.
- Distinguish cycle rate from plot amplitude and sound loudness; compare fresh records and leave a rate unknown when elapsed time is missing.
Try it yourself
Pause at C: 18 cycles in 3 seconds, D: 16 in 2 seconds, and E with missing time. Calculate the known rates and explain the unknown.
Continue to both frequency worksheets. Divide each new cycle count by its elapsed seconds; do not infer frequency from a taller drawing or a louder description.
Next: your worksheet
Count Frequency rather than Loudness - Practice 1https://s3u.com/sr6bw
Practice Two: more frequency records · Practice counting cycles per second
Lesson: https://s3u.com/listen/count-cycles-not-height