Science / Grade 11
Model a single-gene cross
Learning goal: Combine gamete probabilities, distinguish genotype from phenotype under a stated dominance rule, and explain why expected ratios are not quotas.
Before you start: Multiply simple fractions and distinguish capital/lowercase allele notation. The lesson defines gametes, genotype and phenotype using fictional plants.
Read or print this lesson What to practiceThe video could not load. The transcript is still available below.
Next: your worksheet
Read a Simplified Single-Gene Cross - Practice 1
Checking sign-in...
Read the transcript
Saved reading place
Video transcript and practice. Reading or printing does not count as playback time or an assessed grade.
1. Two copies in a stated model
Video: 0:00
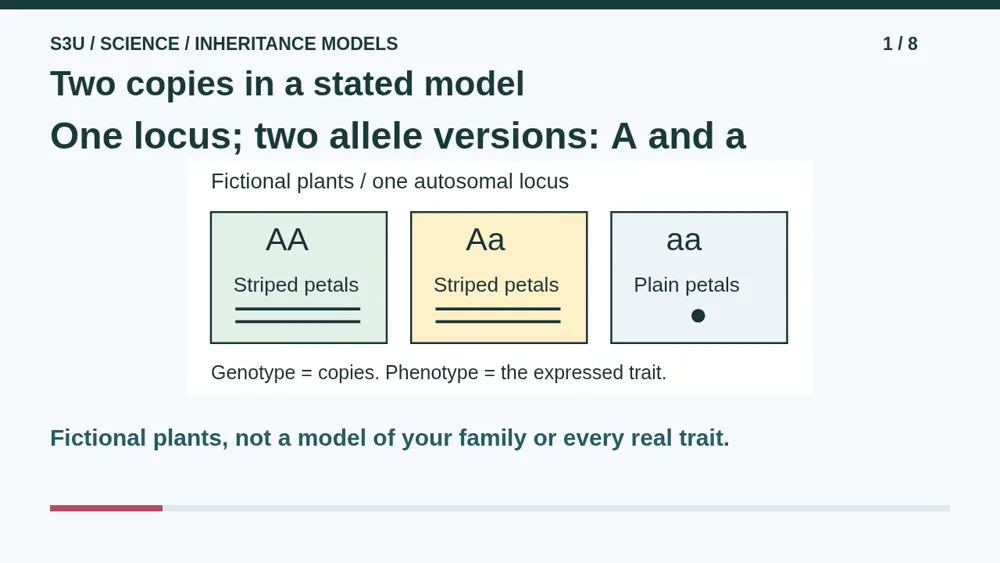
Imagine fictional plants with a single autosomal gene location, called a locus, that affects petal pattern. Each plant has two copies. Our model uses two allele versions, written capital A and lowercase a. Two capitals or one of each gives striped petals; two lowercase copies gives plain petals. This is a stated complete-dominance model. Real traits can be more complicated. We will not infer anything about your family from it.
2. Each gamete carries one copy
Video: 0:34
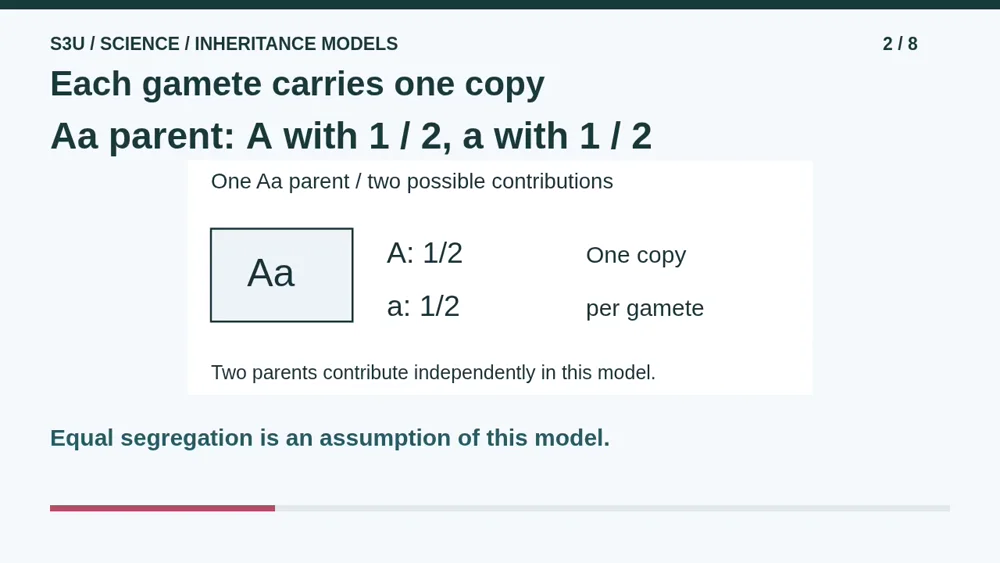
A reproductive cell is called a gamete. In our model, each gamete carries one copy at this locus. A plant with one capital and one lowercase copy can contribute either version, each with probability one half. Those are alternatives, not both copies squeezed into one gamete. We assume the two parents contribute independently. These assumptions let us calculate possibilities before we discuss what any plant looks like.
3. Combine one copy from each parent
Video: 1:07
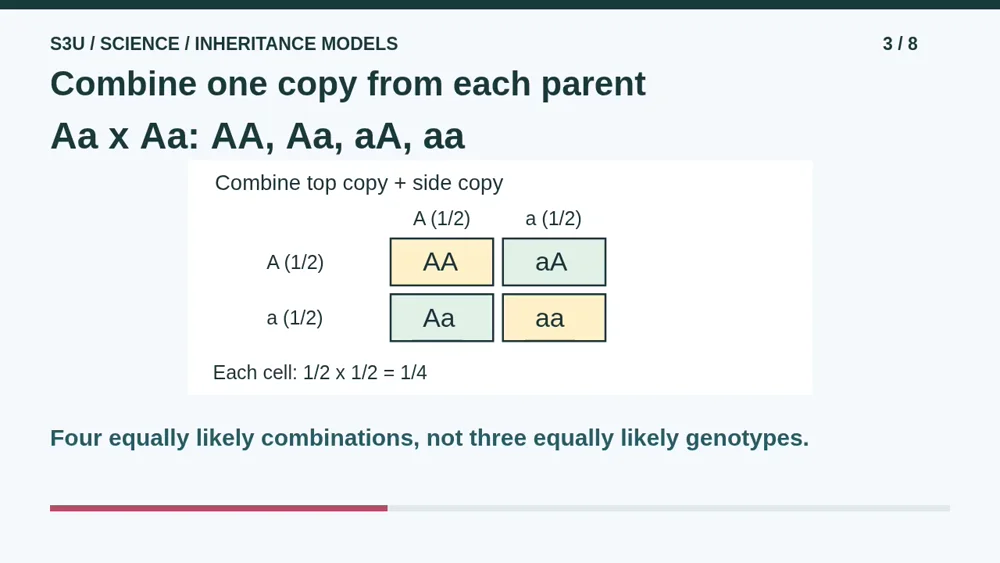
Cross two plants that each have one copy of each version. Put one parent across the top and the other down the side. Combine the column letter with the row letter in each cell. The four combinations are two capitals, capital then lowercase, lowercase then capital, and two lowercase copies. Each cell has probability one half times one half, or one quarter. The two mixed cells have the same genotype, but represent two different ways to get it.
4. Genotype and visible pattern
Video: 1:41
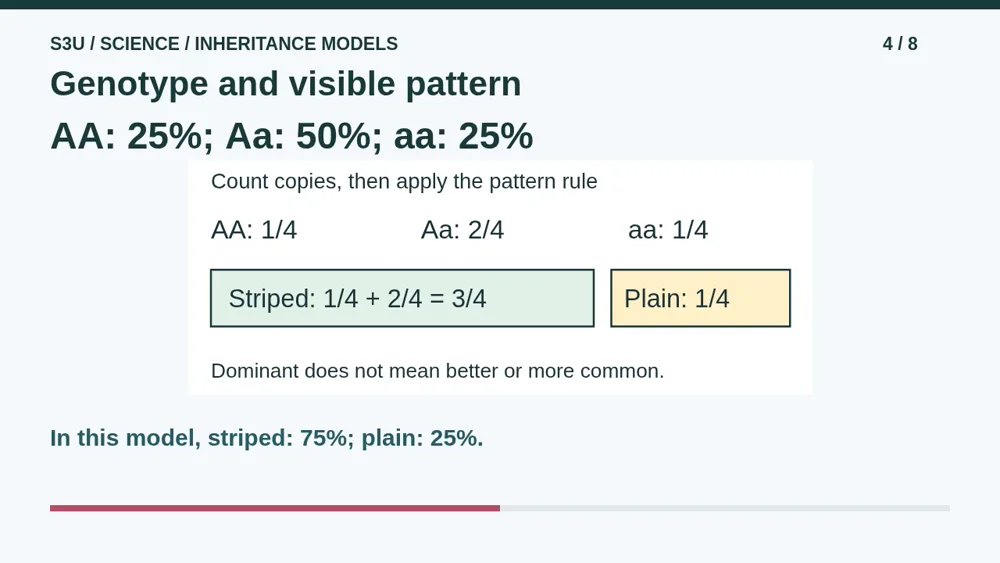
Genotype describes the allele combination. Counting the cells gives twenty-five percent two capitals, fifty percent mixed copies, and twenty-five percent two lowercase copies. Under our stated complete-dominance rule, the first two genotypes both give striped petals, totaling seventy-five percent. Plain petals have probability twenty-five percent. Dominant does not mean better, stronger, or necessarily more common in a population. It names how the two versions affect this model trait together.
5. Pause: change one parent
Video: 2:18
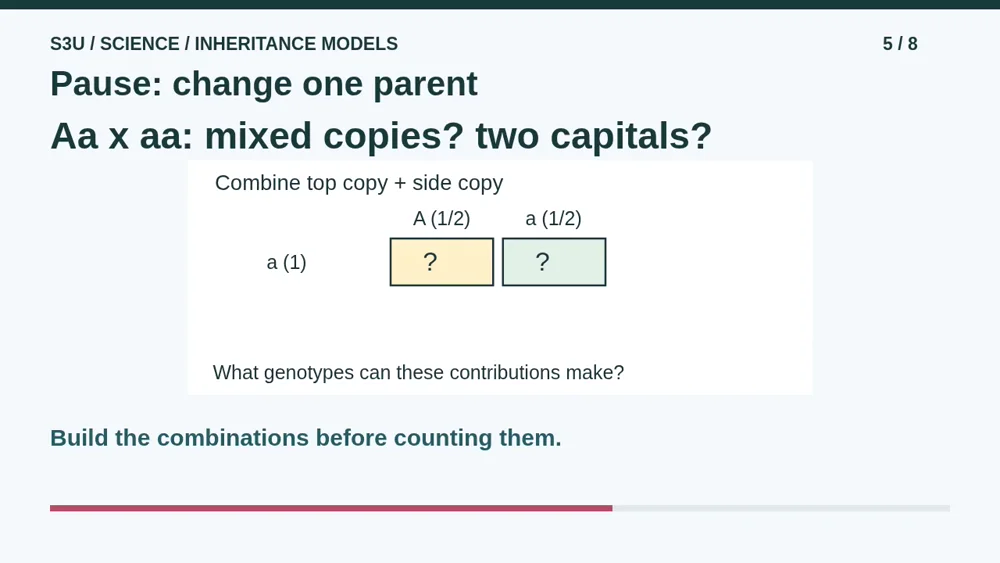
Now one parent has a capital and a lowercase copy, but the other has two lowercase copies. Pause the video. What percentage of offspring are expected to have mixed copies, and can any have two capital copies? Draw the grid or describe the possible contributions aloud. The second parent can only contribute lowercase. Work from that fact rather than copying the percentages from the previous cross.
6. Check the new combinations
Video: 2:49
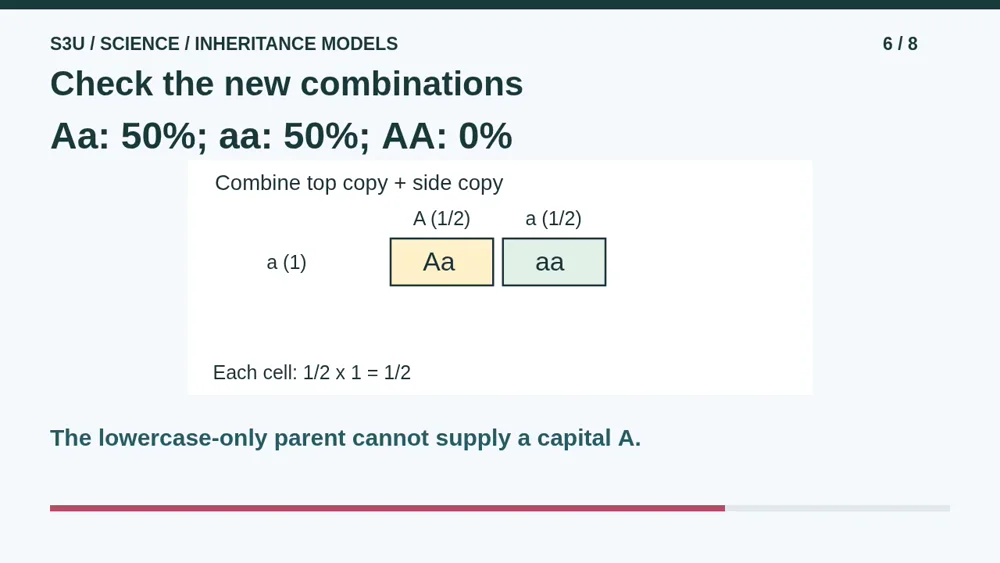
Our new grid needs only one row because the lowercase-only parent always contributes that version. There are two equally likely combinations: mixed copies and two lowercase copies. Each has probability fifty percent. Two capital copies are impossible because that parent cannot supply a capital. In our pattern model, half are expected to be striped and half plain. Listing the same lowercase contribution twice would repeat the row, not change these probabilities.
7. A probability is not a quota
Video: 3:25
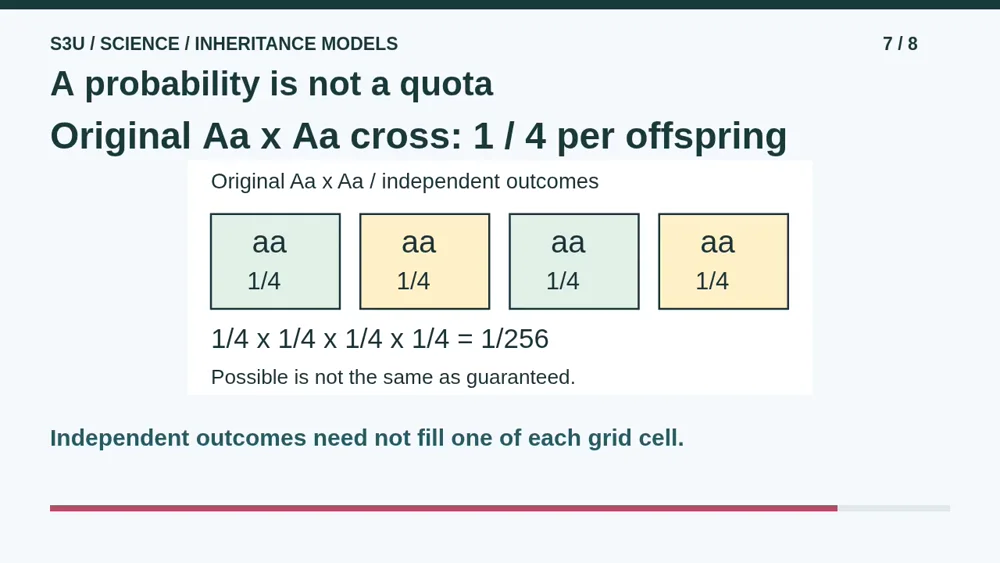
Fun fact: for the original cross between two mixed-copy parents, even four plain offspring in a row are possible. With independent outcomes and unchanged assumptions, the probability is one quarter multiplied four times, or one in two hundred fifty-six. A twenty-five percent chance does not promise exactly one plain plant in every four. The grid is a probability model, not a seating chart assigning each offspring its own compulsory square.
8. Continue to the worksheet
Video: 3:59
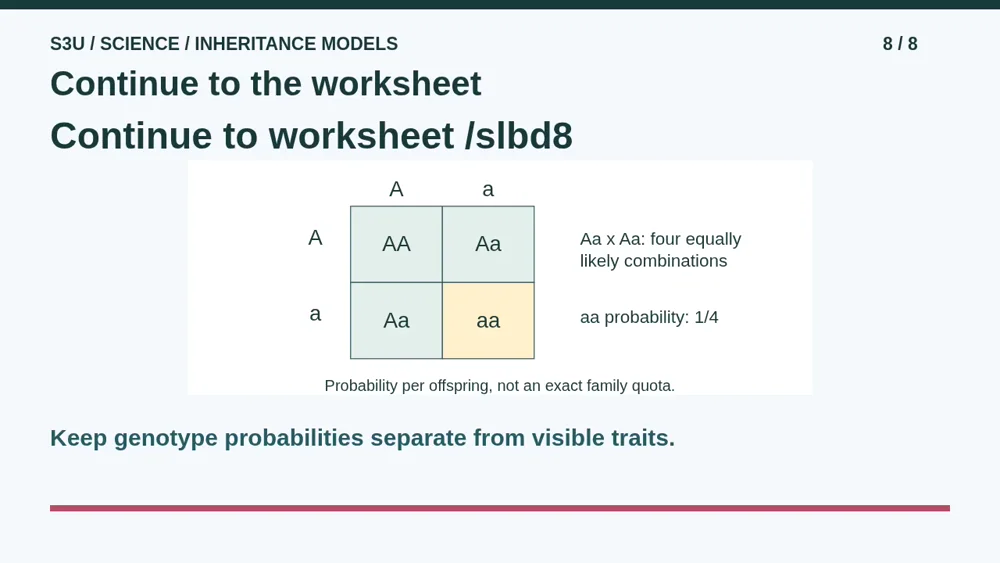
Continue to the worksheet and its second practice page. Use each supplied pair of parental genotypes, list possible contributions, combine them, and count the requested genotype. Write percentages without the percent sign where the page asks for a number. Do not turn an expected proportion into a guaranteed family count. These are fictional single-gene cases with stated assumptions, not predictions about human appearance, health, or ancestry.
Show your understanding
You can point, explain aloud, draw or write.
- Combine stated independent gamete probabilities and calculate genotype probabilities without discarding repeated ways to obtain one genotype.
- Apply the stated complete-dominance rule separately and explain why expected proportions are not quotas or predictions about every real trait.
Try it yourself
Pause at Aa crossed with aa. Find the probability of mixed copies and explain why two capital copies are impossible.
Continue to the worksheet and Practice Two. These are fictional single-locus models, not predictions about personal appearance, ancestry or health.
Next: your worksheet
Read a Simplified Single-Gene Cross - Practice 1https://s3u.com/slbd8
Lesson: https://s3u.com/lessons/model-a-gene-cross