Science / Grade 8
Keep the final test separate
Learning goal: Distinguish training, validation and final testing; calculate accuracy and inspect different error types in invented card tables.
Before you start: Read a row-and-column count table, add whole numbers and convert a fraction to a percentage, including decimals.
Read or print this lesson What to practiceThe video could not load. The transcript is still available below.
Next: your worksheet
Test a Predictor on Unseen Examples
Checking sign-in...
Read the transcript
Saved reading place
Video transcript and practice. Reading or printing does not count as playback time or an assessed grade.
1. Give the examples different jobs
Video: 0:00
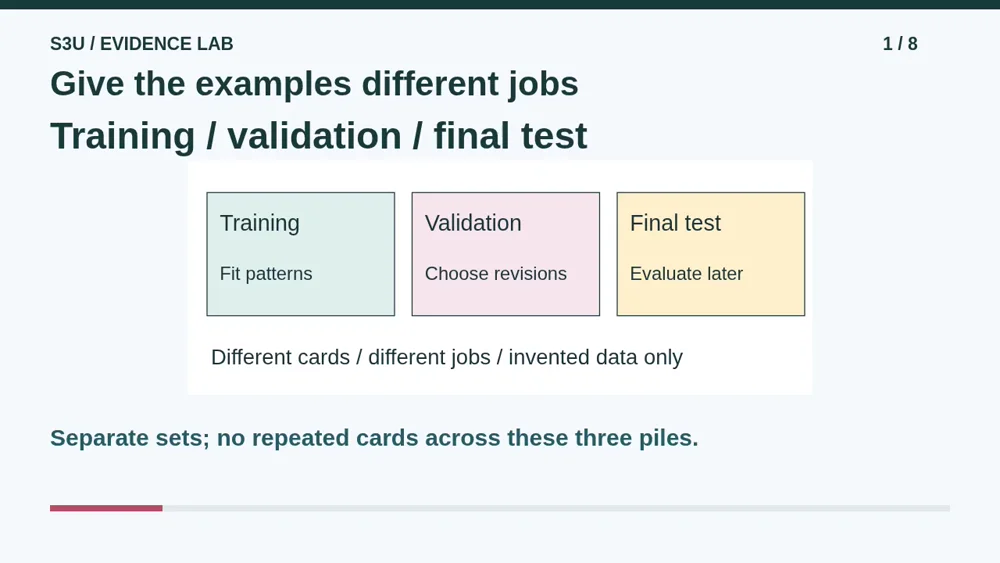
Imagine a paper predictor that labels invented tiles as ready or cracked. We give different examples different jobs. Training examples help fit the predictor. Separate validation examples help us choose revisions. Final test examples stay out of both jobs until evaluation. These are made-up cards, not a tool for deciding whether a real tile or building is safe.
2. Keep the final answers out of revisions
Video: 0:30
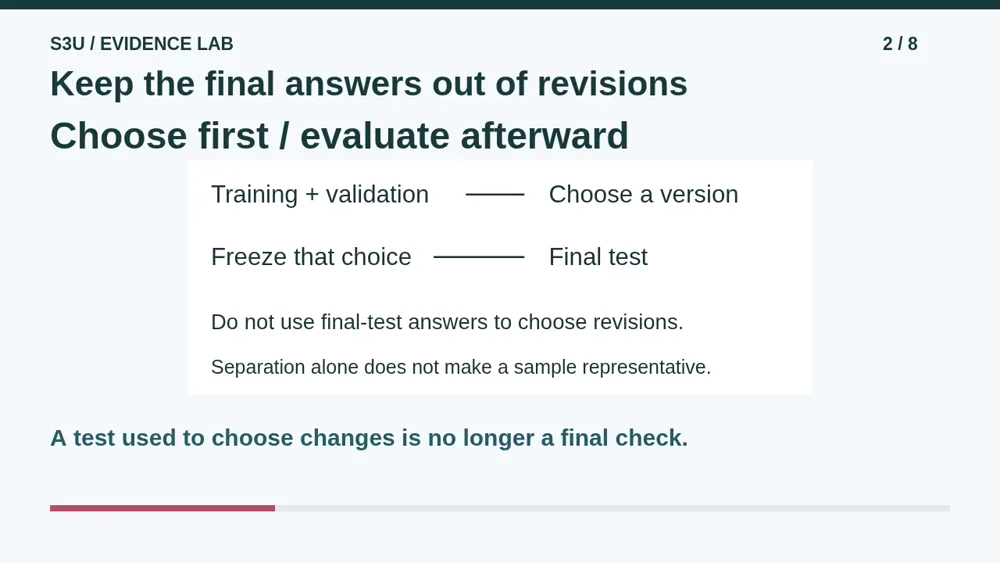
Our team uses training and validation results to choose a version, then freezes that choice before the final test. Looking at final-test mistakes and tuning to those answers uses the test for development. It is no longer an untouched final check of that revision. Keep examples separate and suited to the situation being studied. A neatly sealed envelope cannot fix an unrepresentative sample.
3. Read what each mistake means
Video: 1:01
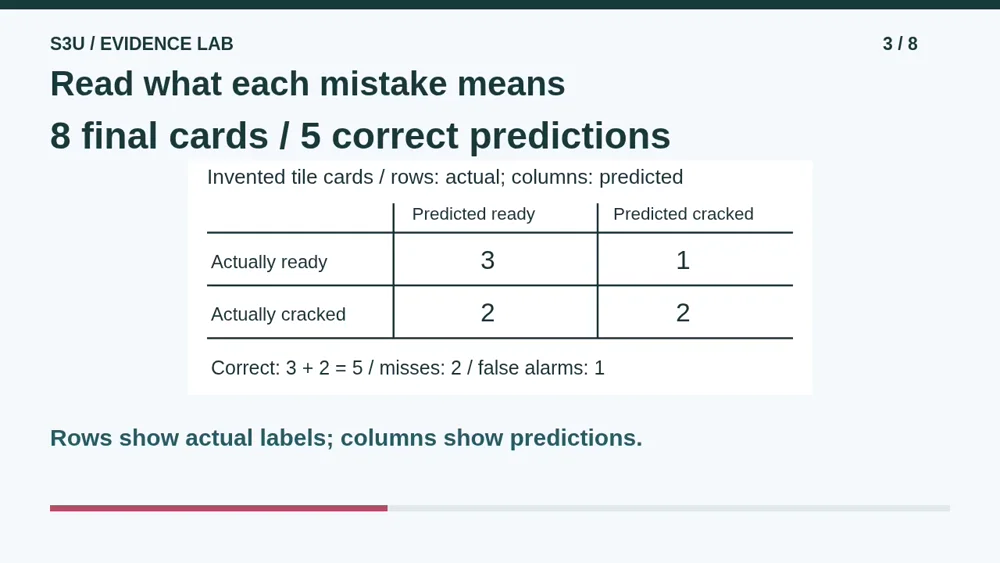
Here are results for eight final cards. Of four actually ready tiles, three were predicted ready and one was predicted cracked. Of four actually cracked tiles, two were predicted ready and two were predicted cracked. The correct groups are three plus two, giving five correct. The two cracked tiles predicted ready are missed cracks; the ready tile predicted cracked is a false alarm.
4. Calculate, then state the limit
Video: 1:29
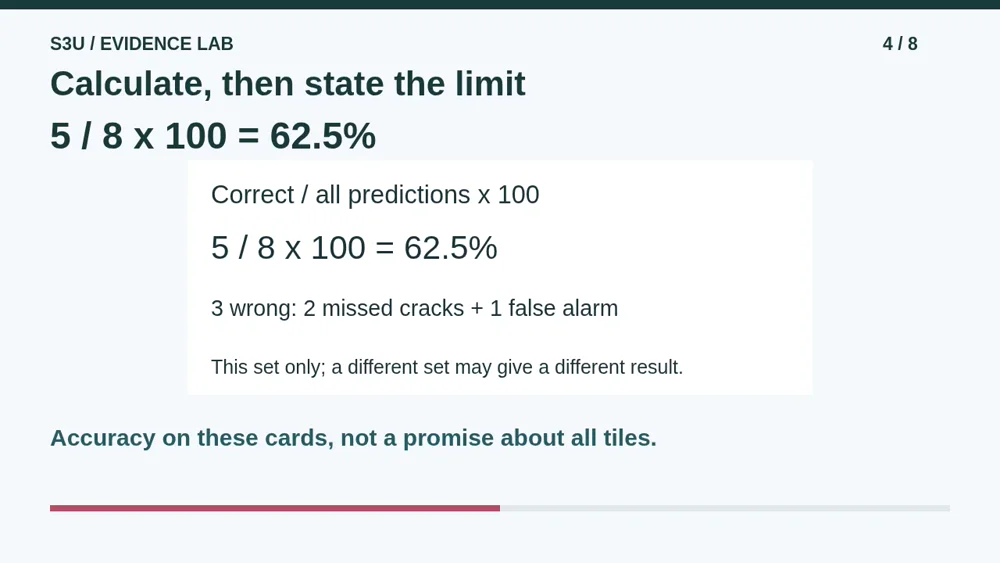
Accuracy on this set is correct predictions divided by all predictions. Five divided by eight, times one hundred, is sixty-two point five percent. Three of the eight predictions were wrong. That percentage summarizes these cards. It does not tell us that all mistakes have the same consequence, prove a cause, or guarantee the same result on a different set of examples.
5. Pause: read a fresh result table
Video: 1:57
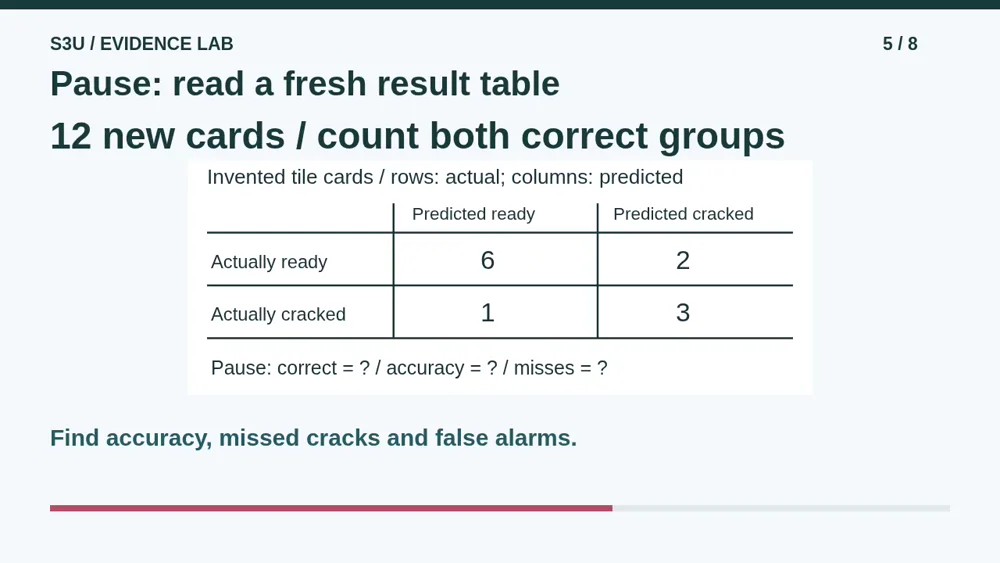
Pause at a new twelve-card table. Six ready tiles were predicted ready, and two ready tiles were predicted cracked. One cracked tile was predicted ready, and three cracked tiles were predicted cracked. Find the total correct and the accuracy percentage. Then identify the missed cracks and false alarms separately. Say which cells you used; the row and column labels matter.
6. Check all three answers
Video: 2:25
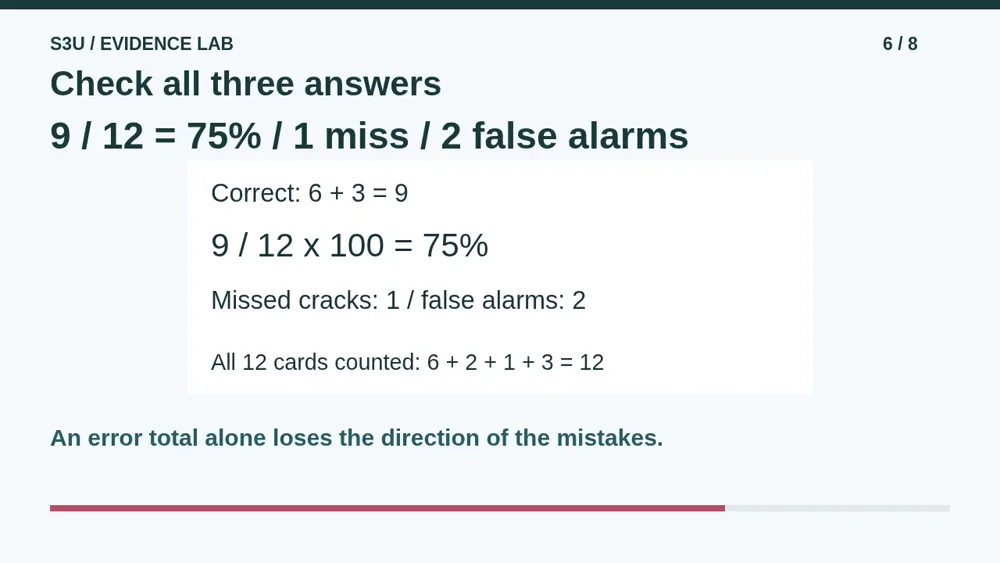
The correct predictions are six plus three, giving nine. Nine out of twelve is seventy-five percent. One cracked tile was missed because it was predicted ready. Two ready tiles were falsely flagged as cracked. All three statements describe the same table, but each tells us something different. A headline that only says seventy-five percent leaves out those error directions.
7. Equal accuracy can hide different errors
Video: 2:53
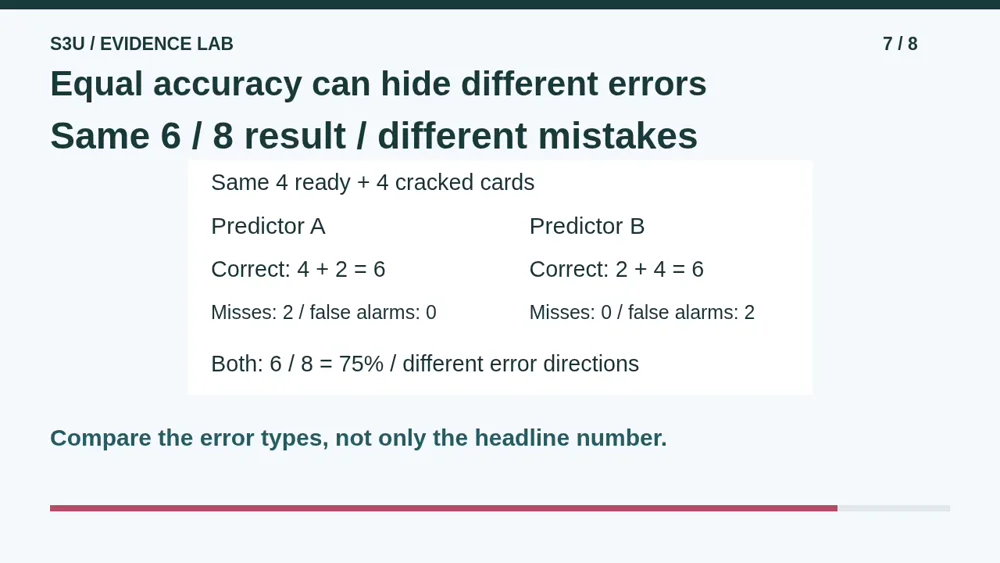
Fun fact: two predictors can both get six out of eight cards right and make different kinds of mistakes. On the same four ready and four cracked cards, predictor A misses two cracks and gives no false alarms. Predictor B misses no cracks but gives two false alarms. Both have seventy-five percent accuracy here. Neither number alone settles which mistakes matter for a particular use.
8. Apply the method to new evidence
Video: 3:22
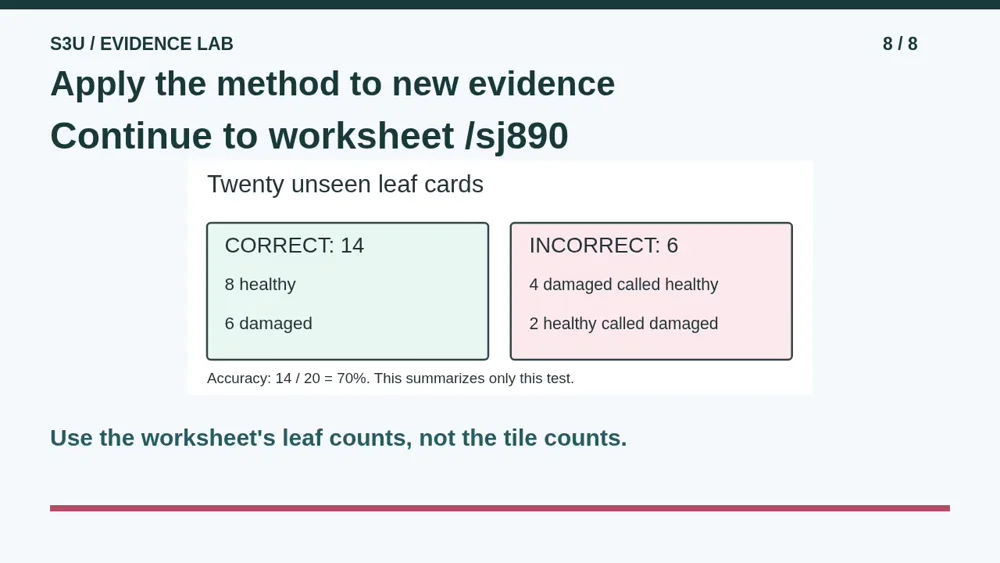
Continue to Test a Predictor on Unseen Examples. Its invented leaf table has different counts. Add its two correct groups, divide by its total, and describe the missed cases. Explain why validation and a reserved final test have different jobs. Use only the supplied fictional data. No real crop decisions, personal records, photos, external accounts or uploaded work are part of this activity.
Show your understanding
You can point, explain aloud, draw or write.
- Explain the separate jobs of training, validation and a final test reserved until after choosing a version.
- Calculate accuracy from both correct groups and separately count missed cases and false alarms without generalizing beyond the stated test.
Try it yourself
Pause at the twelve-card table. Count both correct groups, calculate accuracy and distinguish missed cracks from false alarms.
Continue to the worksheet using its leaf counts, not the video tile counts. Explain why final-test answers must not choose revisions. This does not evaluate real crop or building safety.
Next: your worksheet
Test a Predictor on Unseen Exampleshttps://s3u.com/sj890
Lesson: https://s3u.com/lessons/keep-the-test-separate