Math / Grade 7
Estimate from a sample
Learning goal: Scale an observed proportion, distinguish an estimate from a counted fact and examine how sample selection affects a conclusion.
Before you start: Read a fraction as part of a total and multiply both parts of a ratio by the same positive number. All records are invented.
Read or print this lesson What to practiceThe video could not load. The transcript is still available below.
Next: your worksheet
Scale a Stated Sample Proportion - Practice 1
Checking sign-in...
Read the transcript
Saved reading place
Video transcript and practice. Reading or printing does not count as playback time or an assessed grade.
1. A small look at a larger group
Video: 0:00
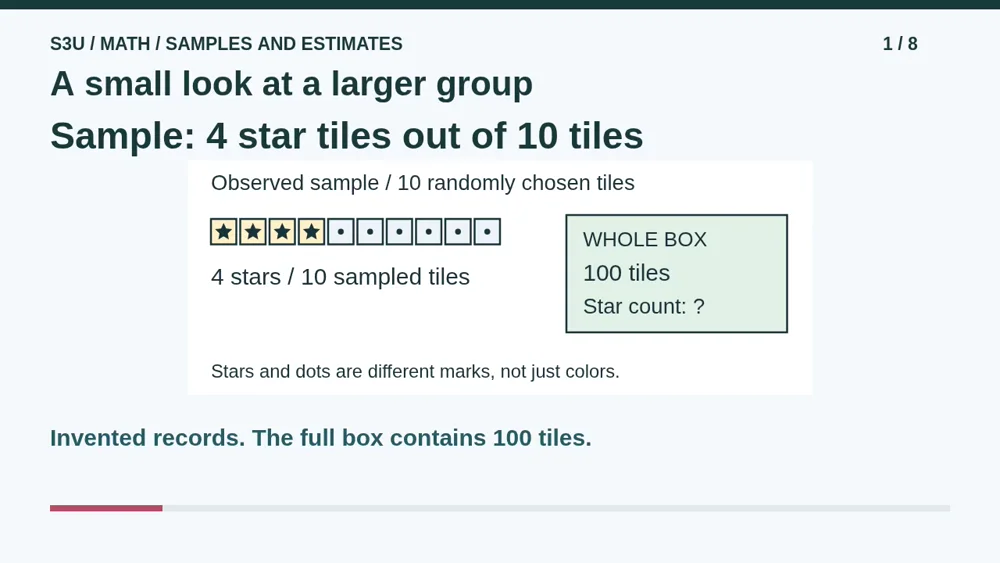
Imagine a box containing one hundred tiles. Some have stars and others have dots. We want to estimate how many have stars without counting the whole box. Our invented record says ten tiles were chosen at random without replacement from the box, and four had stars. Those ten tiles are the sample. The whole hundred is the population. Counting the sample does not reveal every tile still in the box.
2. Scale both parts together
Video: 0:32
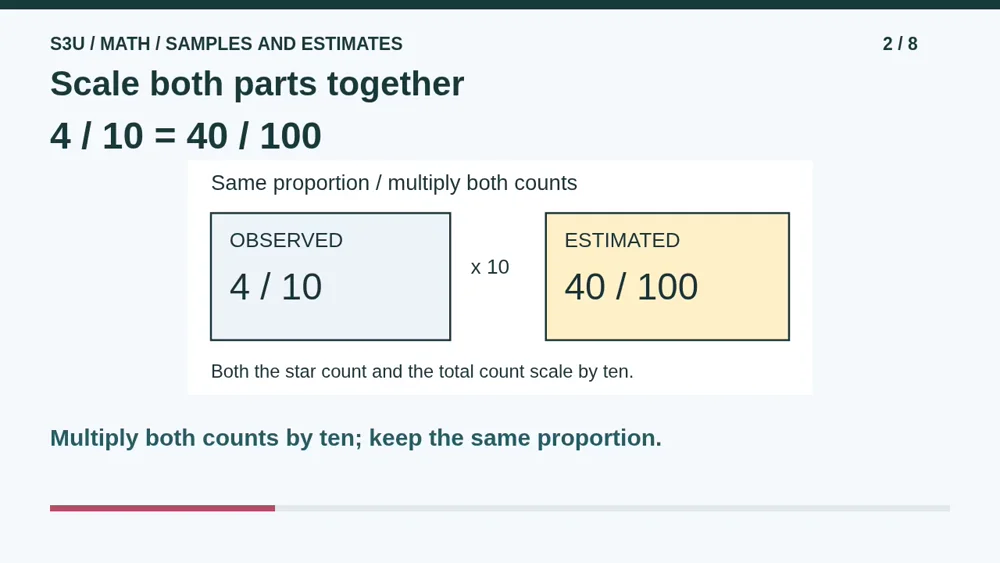
Four out of ten is our observed star proportion. To use that proportion for one hundred tiles, multiply both counts by ten. Four becomes forty, and ten becomes one hundred. We estimate forty star tiles in the whole box. The picture shows an equal-proportion model, not a photograph of the hidden tiles. Multiplying the numbers did not secretly count the rest of the box for us.
3. Keep the estimate label
Video: 1:01
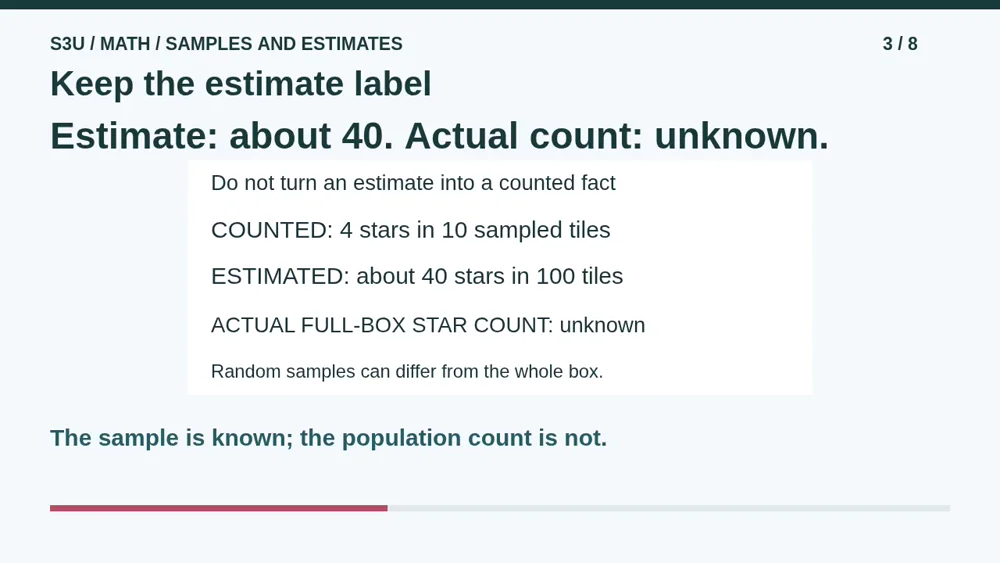
Say about forty, based on this sample. Do not say exactly forty stars were counted in the whole box. We counted four stars in ten sampled tiles. The estimate assumes that the sample proportion is a useful guide to the population proportion. Random selection helps avoid deliberately favoring certain tiles, but even a properly selected sample can differ from the whole box. An estimate is useful without being a promise.
4. Ask how the sample was chosen
Video: 1:34
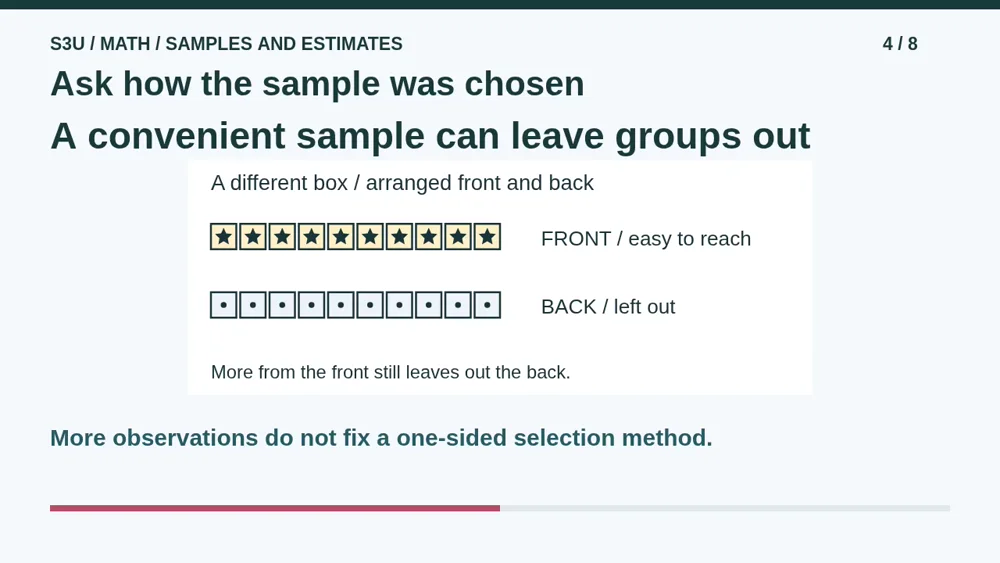
Now imagine a different box arranged with stars at the front and dots at the back. Taking only the easy-to-reach front tiles could overestimate the star proportion. Taking more tiles from that same front section does not fix the selection problem. For our random-sample model, each tile must have a fair chance of selection, not just the tiles nearest your hand. Ask how the sample was chosen before trusting its estimate.
5. Pause: a different sample size
Video: 2:05
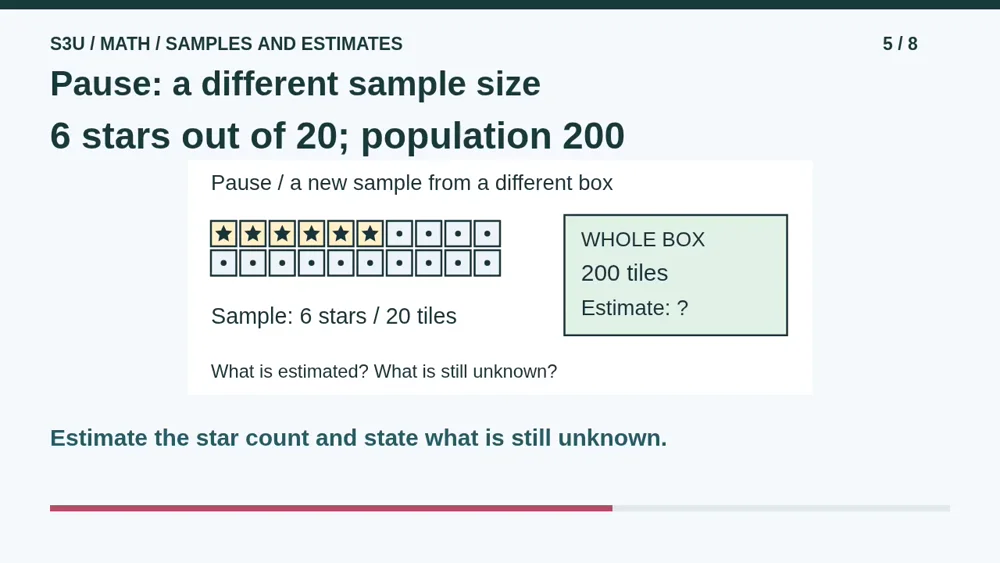
Try a new invented record. A different box holds two hundred tiles. A random sample of twenty tiles, chosen without replacement, contains six stars. Pause the video. Use the observed proportion to estimate the number of stars in all two hundred tiles. Explain which two counts you scale, and say whether the actual full-box star count is known. You may write a fraction, draw matching groups, or explain aloud.
6. Check the scale and the conclusion
Video: 2:38
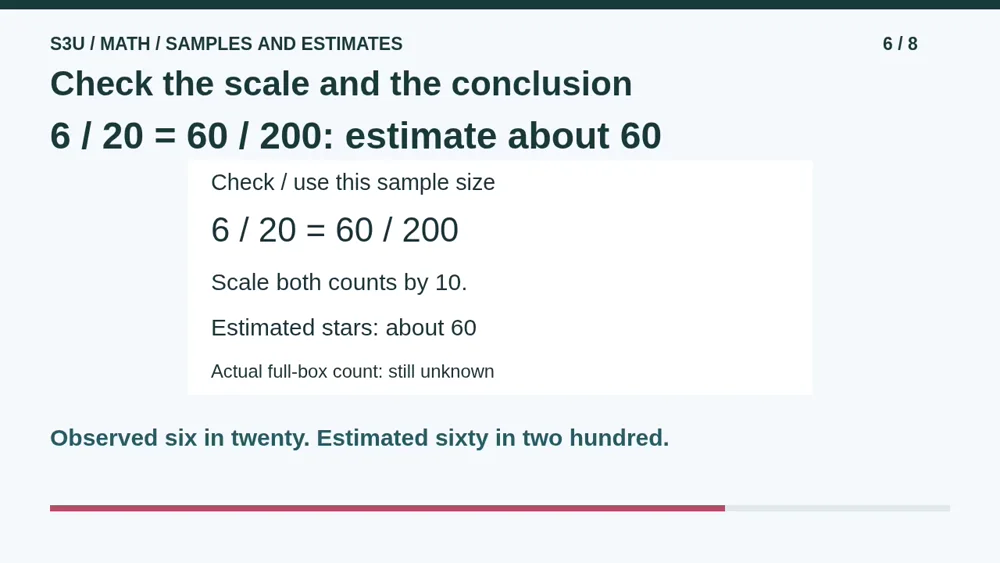
Two hundred is ten times twenty. Multiply the star count by the same ten: six becomes sixty. So we estimate about sixty stars among the two hundred tiles. We do not divide by ten just because the earlier example used a sample of ten. This sample has twenty. The actual full-box count remains unknown; scaling the sample gives an estimate, not a complete inspection.
7. One population, different samples
Video: 3:08
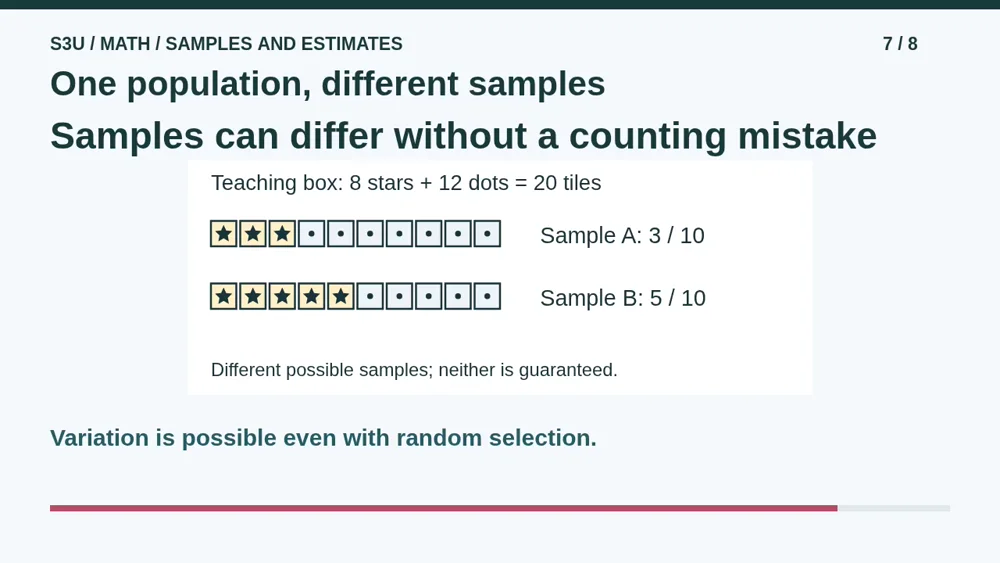
Fun fact: two random samples from the same box can give different proportions. Consider a small teaching box with eight star tiles and twelve dot tiles. A ten-tile sample could contain three stars. Another ten-tile sample could contain five. Both are possible, even with correct counting and random selection. Random does not mean every sample matches perfectly. A difference alone is not proof that somebody counted badly.
8. Continue to the worksheet
Video: 3:41
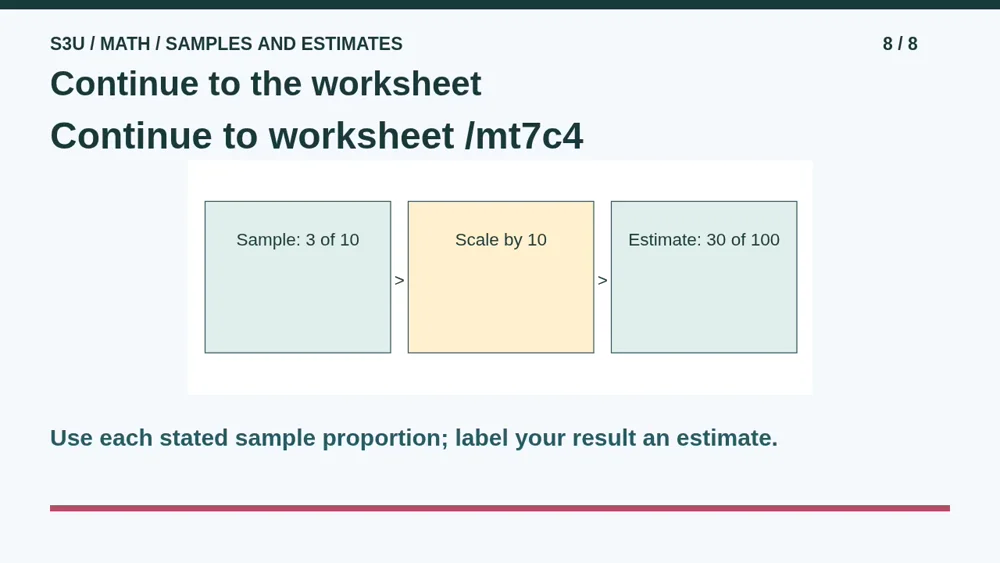
Continue to the worksheet below. Read the sample and population sizes in each question, then scale the star or color count using the same proportion. These worksheet examples use blue tokens instead of stars. Practice Two has further estimates, including a larger population. Work on screen or print the pages. Explain why your answer is an estimate, and remember that a stated sample alone does not tell you how fairly it was selected.
Show your understanding
You can point, explain aloud, draw or write.
- Scale the stated sample proportion to estimate a population count and distinguish what was counted from what remains unknown.
- Explain how one-sided selection can distort an estimate and why properly selected samples can still differ.
Try it yourself
Pause at 6 star tiles out of 20, with a population of 200. Estimate the full-box star count and explain what remains unknown.
Continue to the worksheet and Practice Two. Scale both counts together, label the estimate and ask how the sample was selected.
Next: your worksheet
Scale a Stated Sample Proportion - Practice 1https://s3u.com/mt7c4
Lesson: https://s3u.com/lessons/estimate-from-a-sample